Parametric curve
A parametric curve is a very fascinating feature in math.
Unlike a scalar-valued function such as \(y=f(x)\), a parametric curve can output multiple values
such as x and y where y is a function of t and x is another function of t.
Therefore, x and y can move independently from each other on the xy-coordinate enabling us to produce
a curve that is not possible by \(y=f(x)\). For example, \(\vec{r}(\theta) = \langle cos(2 \theta ), sin( \theta ) \rangle \)
is a vector-valued function that goes back and forth on the same path.
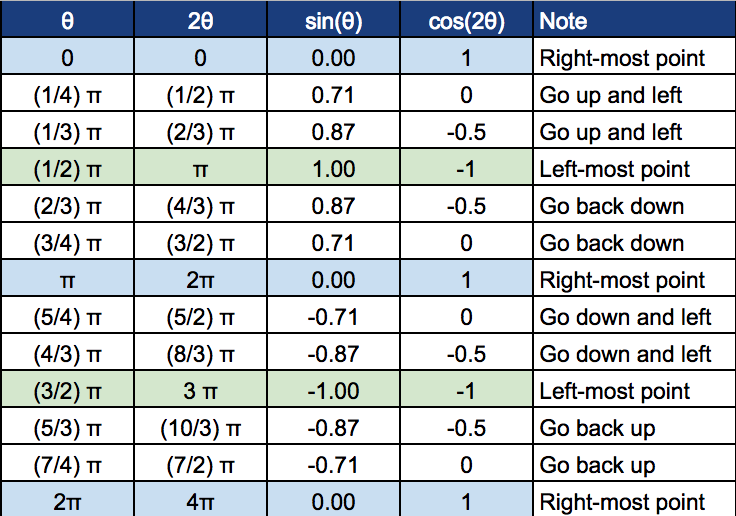
Below table shows how \(cos(2 \theta) \) and \(sin (\theta) \) change as \( \theta \) changes.

You can see that as \( \theta \) approaches \( \frac{1}{2} \pi \), the curve moves toward (-1, 1).
Once \( \theta \) reaches \( \frac{1}{2} \pi \) and the curve reaches (-1, 1), it turns around and goes back on the same path towards (1, 0).
I created a video clip to illustrates this and posted it on YouTube.
You can click the below screenshot to jump to the video.

Animation was created in Python with numpy & matplotlib. Source code is available in
my repo
on github.
 You can see that as \( \theta \) approaches \( \frac{1}{2} \pi \), the curve moves toward (-1, 1).
Once \( \theta \) reaches \( \frac{1}{2} \pi \) and the curve reaches (-1, 1), it turns around and goes back on the same path towards (1, 0).
I created a video clip to illustrates this and posted it on YouTube.
You can click the below screenshot to jump to the video.
 Animation was created in Python with numpy & matplotlib. Source code is available in
my repo
on github.